 Backstory Report
WaterCase File 002
Why a Quarter of the Netherlands Is Below Sea Level
About a quarter of the country lies below sea level, and much of it sank because people drained it.
What the record shows
- About 26 per cent of the Netherlands lies below sea level (PBL).
- Draining the coastal peat, from about AD 1000, made the land sink (Erkens et al. 2016).
- After the flood of 1953, the Delta Works shortened the coast (Rijkswaterstaat).
The film
13 min. The film goes up on the Backstory Report channel; its full narration is the story below.
A quarter of the country lies below the sea
About a quarter of the Netherlands lies below sea level. Much of it was never sea at all. It sank, because people drained it.
This is how a swamp became a country, and why it has to be pumped dry every day.
Draining the peat made the land sink
A thousand years ago, the west of this map was a wet peat bog. Behind a line of coastal dunes, reeds and moss had built up deep, spongy ground. Rivers wandered through it to the sea.
“Between AD 1000 and 1300, the coastal peatlands were drained to create arable land in a cooperative effort, creating the water boards that still manage water in the Netherlands.”
Erkens et al. 2016, introduction
Between about 1000 and 1300, farmers cut ditches to drain it. Drier peat could grow crops. To share the work, they formed water boards, which still manage Dutch water today. Around the fields they raised dikes, banks of earth against the sea and the rivers.
But peat is mostly water and dead plants. Drained, it packs down. Open to the air, it slowly rots away. The drier the farmers made the land, the lower it sank.
Over a thousand years, drainage alone lowered the coastal peatlands by about two metres on average, and peat digging took far more in places. That took most of it below sea level.
From the 1300s, water no longer ran off the fields on its own. It had to be lifted. So more and more windmills went up, pumping water into canals behind earth dikes, and out to the rivers.
Every time the water table dropped, the peat sank further. Every time it sank, the pumps had to lift higher. This is the trap at the heart of the Dutch landscape.
The 1421 flood grew a legend
Peat was also fuel. From around 1100, people dug it out and burned it. Whole districts were cut away, leaving lakes up to about six metres deep.
In November 1421, a storm surge drove into this low, cut-over country. It is remembered as the Saint Elisabeth flood. South of Dordrecht, it broke into a farming district called the Grote Waard.
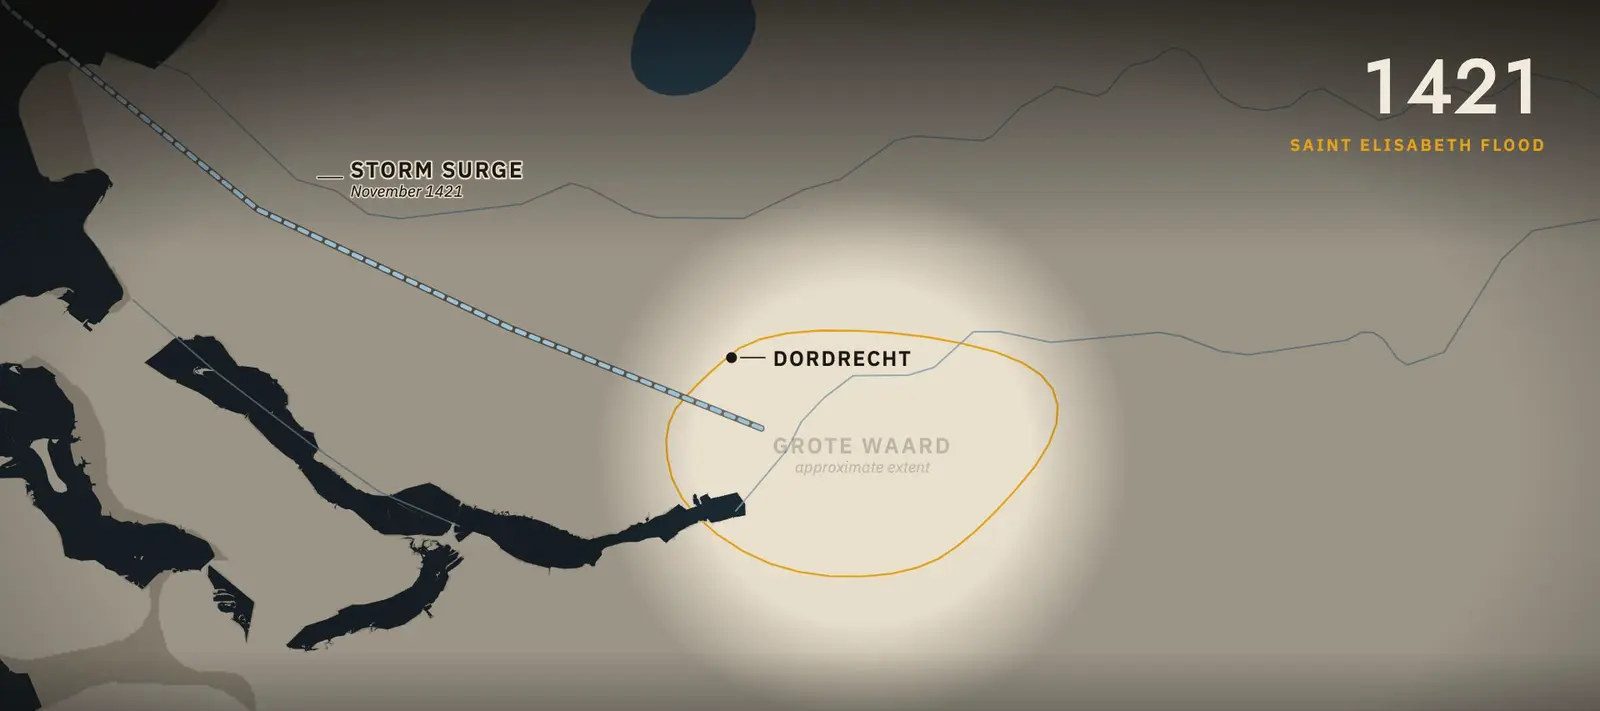
The district was never won back. The tide came in day after day, repairs failed, and the fields stayed under water. Much of it is now the Biesbosch, a maze of creeks and reed.
How many died is not known. A chronicle from about 1450 says two thousand people drowned across Holland, "it is said". Later stories grew to 72 villages and 100,000 dead.
A 2021 study notes that fewer than 30 villages lay in the Grote Waard, with under 30,000 people. Its flood model suggests the drowned there numbered a few dozen. The true figure is still debated.
Another famous flood story is not a Dutch folk tale. The boy who plugs a leaking dike with his finger was made famous by an American novel, published in 1865. His statue at Spaarndam went up in 1950, largely for visitors.
Windmills and steam pumped out the lakes
The peat lakes grew in every storm, eating the farmland on their shores. In the 1600s, merchants saw an opportunity. Drain the lake, and farm the bottom.
“physical compaction of peat and its degradation by oxidation lead to subsidence”
Erkens et al. 2016
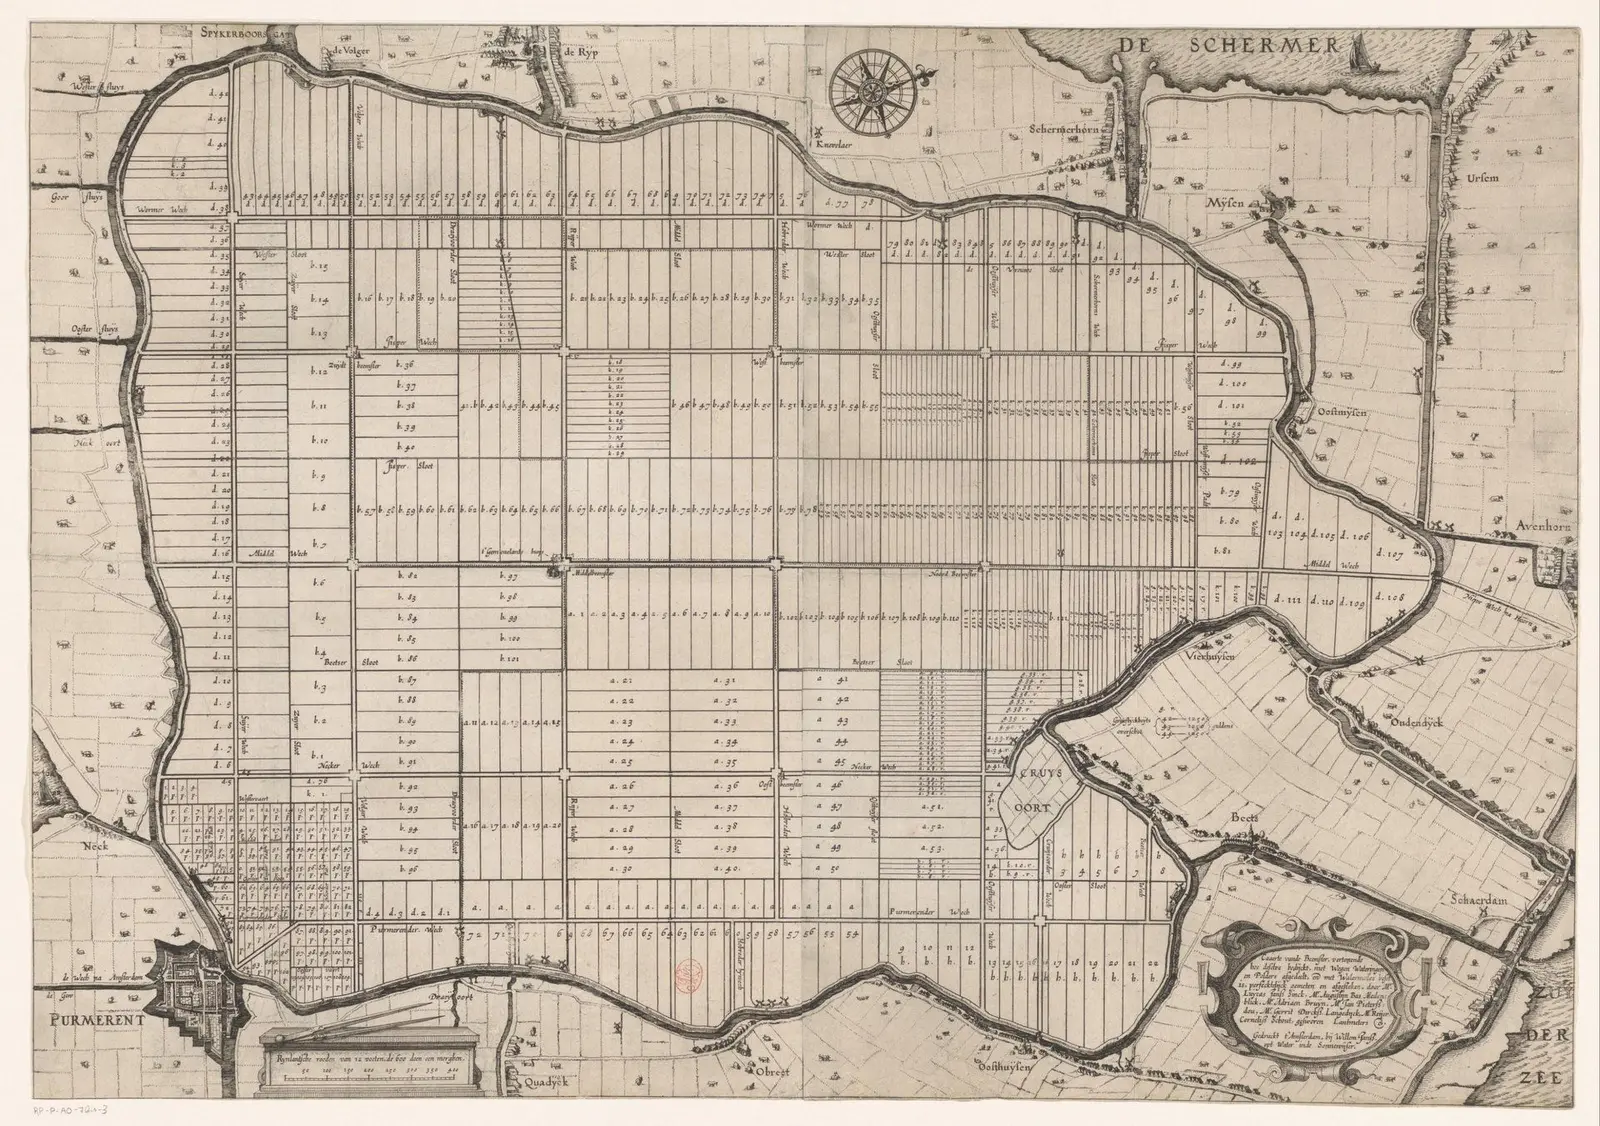
North of Amsterdam lay a lake called the Beemster. A dike was built around it, and 43 windmills pumped it dry by 1612. The engineer Jan Leeghwater helped place them.
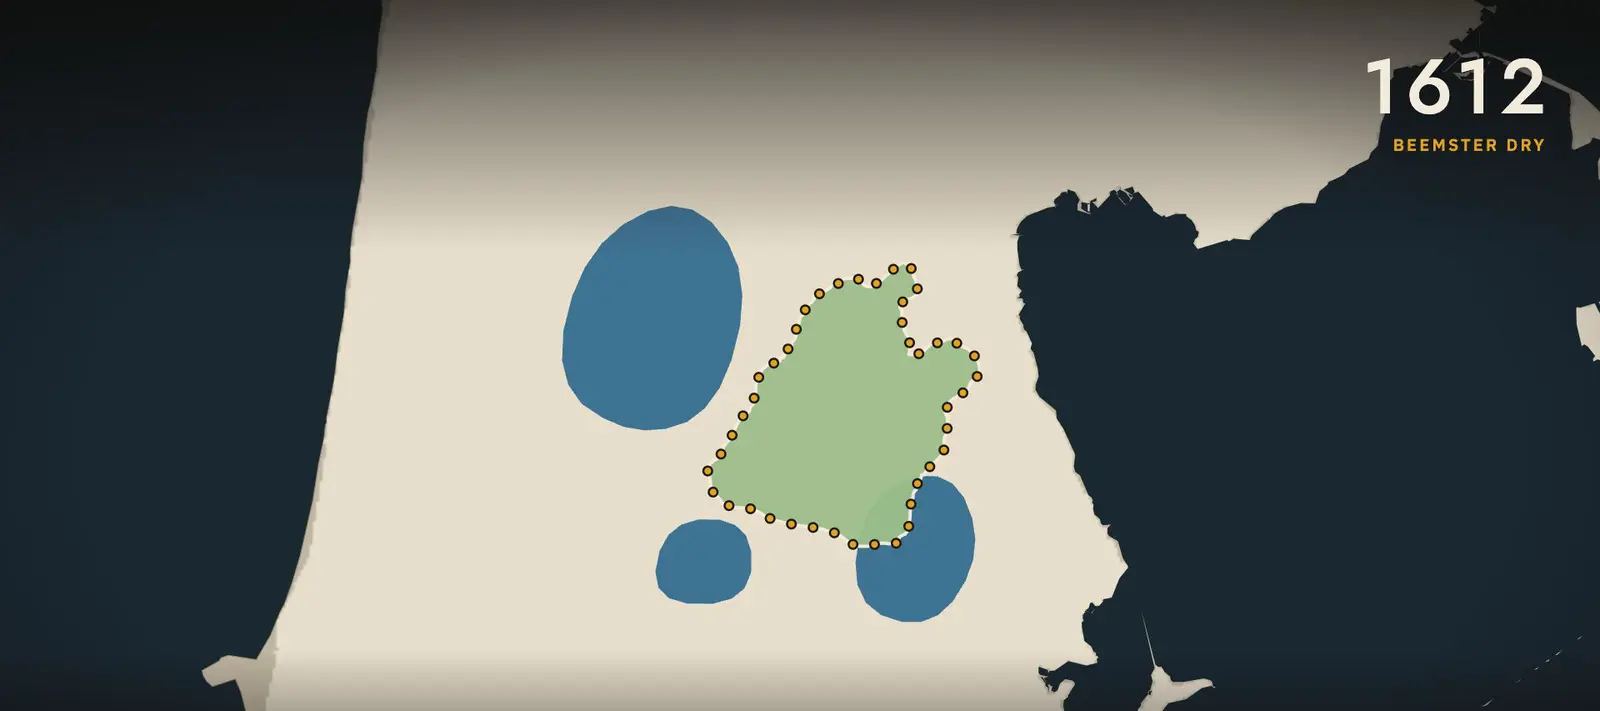
The old lake bed became about 7,200 hectares of farmland, laid out in a grid of straight roads, canals and fields. Land ringed by dikes, with its water level held by pumps, is called a polder. The Beemster is now a World Heritage Site.
Mills worked in chains, each lifting the water one step higher. At Kinderdijk, 19 mills still stand, most of them built in 1738 and 1740.
The biggest lake needed more than wind. The Haarlemmermeer lay between Amsterdam, Haarlem and Leiden. From 1849 to 1852, three steam pumping stations drained it.
They lifted out about 800 million cubic metres of water. About 18,000 hectares of new land appeared. Schiphol Airport now sits on that old lake bed. One of the three engines, the Cruquius, is now a museum.
Land won from water, a thousand years in steps
Polders fill in as they fall dry; the white squares are the Delta Works, shown from the year each was finished.
- 1000 to 1300
Coastal peat drained for farming; water boards formed
- November 1421
Saint Elisabeth flood; Grote Waard lost
- 1612
Beemster dry (43 windmills)
- 1942
Noordoostpolder dry
- 31 Jan to 1 Feb 1953
North Sea flood; 1836 dead
- 1957
Oostelijk Flevoland dry
- 1968
Zuidelijk Flevoland dry
- 4 Oct 1986
Eastern Scheldt barrier opened
- 1997
Maeslantkering and Hartelkering finished
The full record, 25 entries
- 1000 to 1300 Coastal peat drained for farming; water boards formed
- from about 1100 Peat dug and burned for fuel
- from the 1300s Natural drainage no longer works; windmills spread
- November 1421 Saint Elisabeth flood; Grote Waard lost
- 1612 Beemster dry (43 windmills)
- 1738 and 1740 Kinderdijk mills built
- About 1840 Zuidplaspolder drained, about 1840
- 1849 to 1852 Haarlemmermeer drained by steam
- January 1916 Zuiderzee flood
- 1918 Zuiderzee Act
- 1930 Wieringermeer dry
- 28 May 1932 Afsluitdijk closed
- 1942 Noordoostpolder dry
- 31 Jan to 1 Feb 1953 North Sea flood; 1836 dead
- 18 Feb 1953 Delta Committee set up
- 1957 Oostelijk Flevoland dry
- 1958 Delta Act; Hollandsche IJsselkering in use
- 1968 Zuidelijk Flevoland dry
- 1 Jan 1986 Flevoland province
- 4 Oct 1986 Eastern Scheldt barrier opened
- Jan to Feb 1995 River high water; over 250000 evacuated
- 1997 Maeslantkering and Hartelkering finished
- 19 Dec 2006 Room for the River approved
- 2010 PBL corrects the IPCC 55 per cent line
- 21 Dec 2023 Maeslantkering closes at its 3 m criterion for the first time
A dam closed the Zuiderzee
The next target was a sea. The Zuiderzee was a shallow arm of the North Sea, reaching deep into the middle of the country.
In January 1916, a storm broke dikes along its shores. Food was short during the First World War. In 1918, the Zuiderzee Act adopted the plan of the engineer and minister Cornelis Lely.
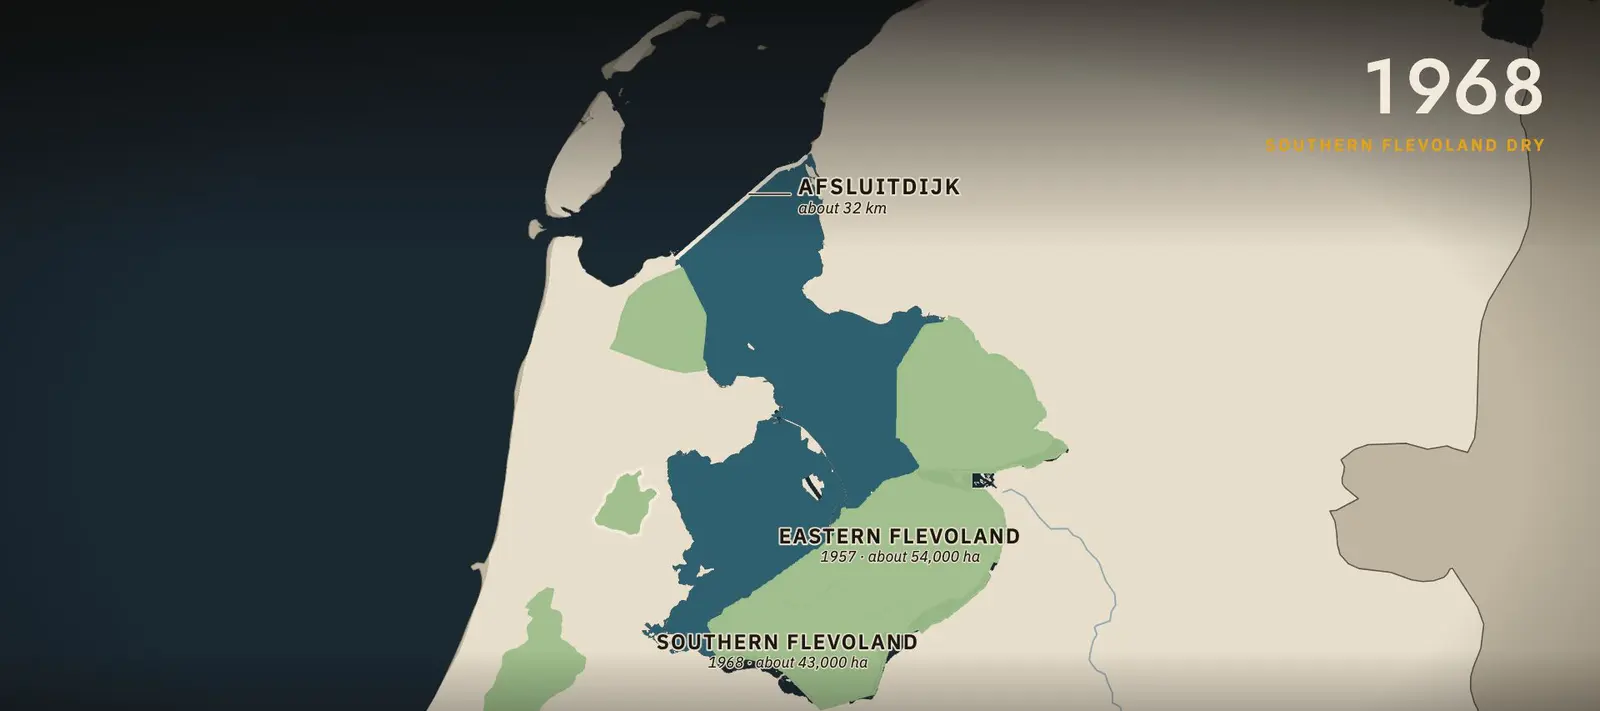
The plan had two parts. First, a dam to cut the Zuiderzee off from the open sea. Then, new polders in the calm water behind it.
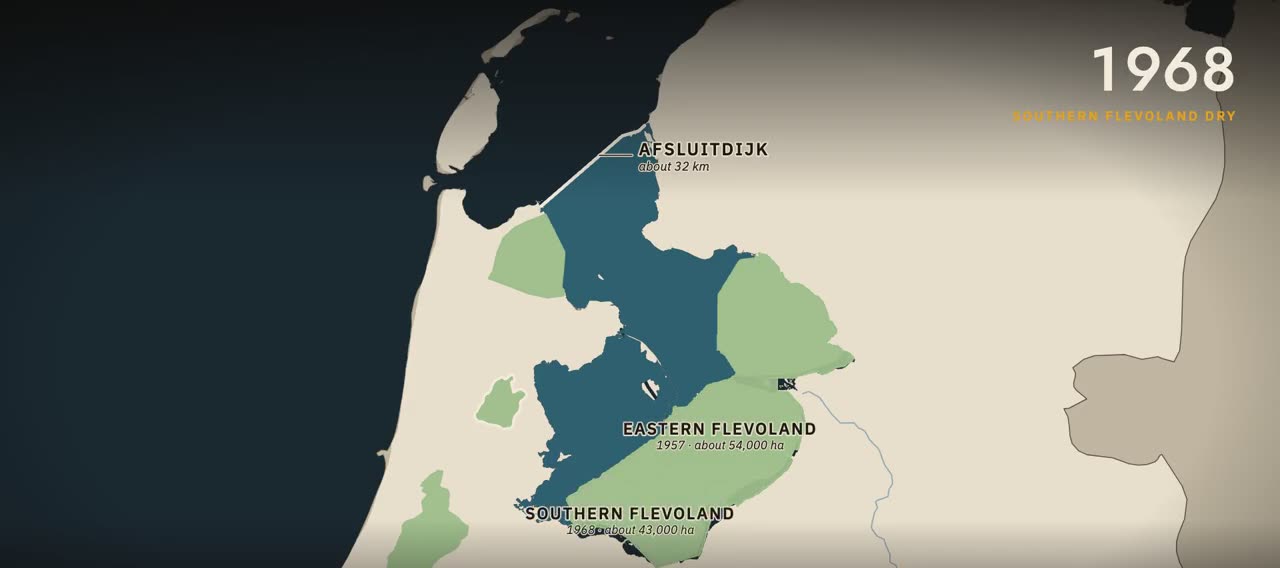
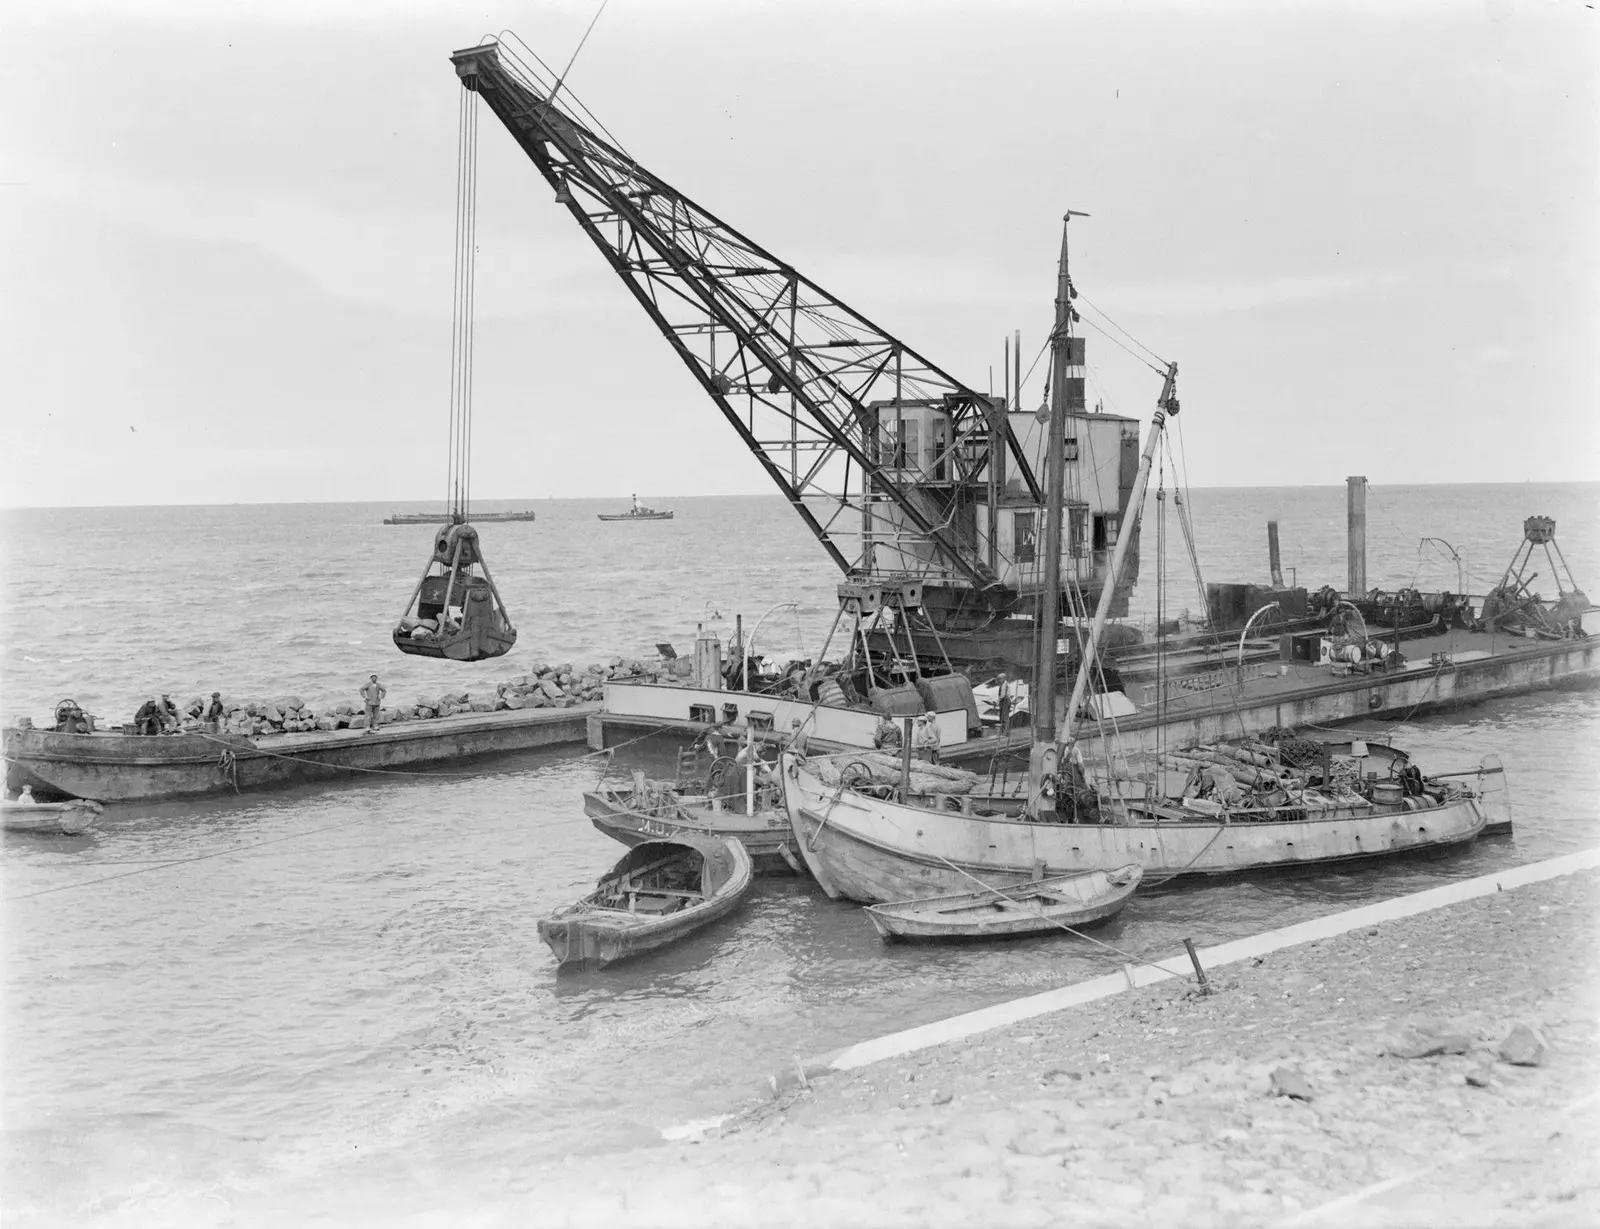
On 28 May 1932, the last gap in the Afsluitdijk was closed. The dam runs about 32 kilometres. Behind it, the salt Zuiderzee slowly became a freshwater lake, the IJsselmeer.
The polders followed. The Wieringermeer fell dry in 1930: about 20,000 hectares. The Noordoostpolder in 1942: about 48,000.
Eastern Flevoland in 1957: about 54,000 hectares. Southern Flevoland in 1968: about 43,000. In all, about 165,000 hectares of new land, where open water had been.
In 1986, the new land became a province, Flevoland. Its capital, Lelystad, is named after Lely. A fifth polder, the Markerwaard, was planned but never drained.
The sea broke in on 31 January 1953
The south-west was still open to the sea. There, the Rhine, the Maas and the Scheldt reach the coast through a maze of islands and estuaries.
“26% of the Dutch land surface is below NAP”
PBL
On the night of 31 January 1953, a north-westerly storm met a spring tide. At Vlissingen, the sea rose to 4.55 metres above the Dutch datum, close to mean sea level.
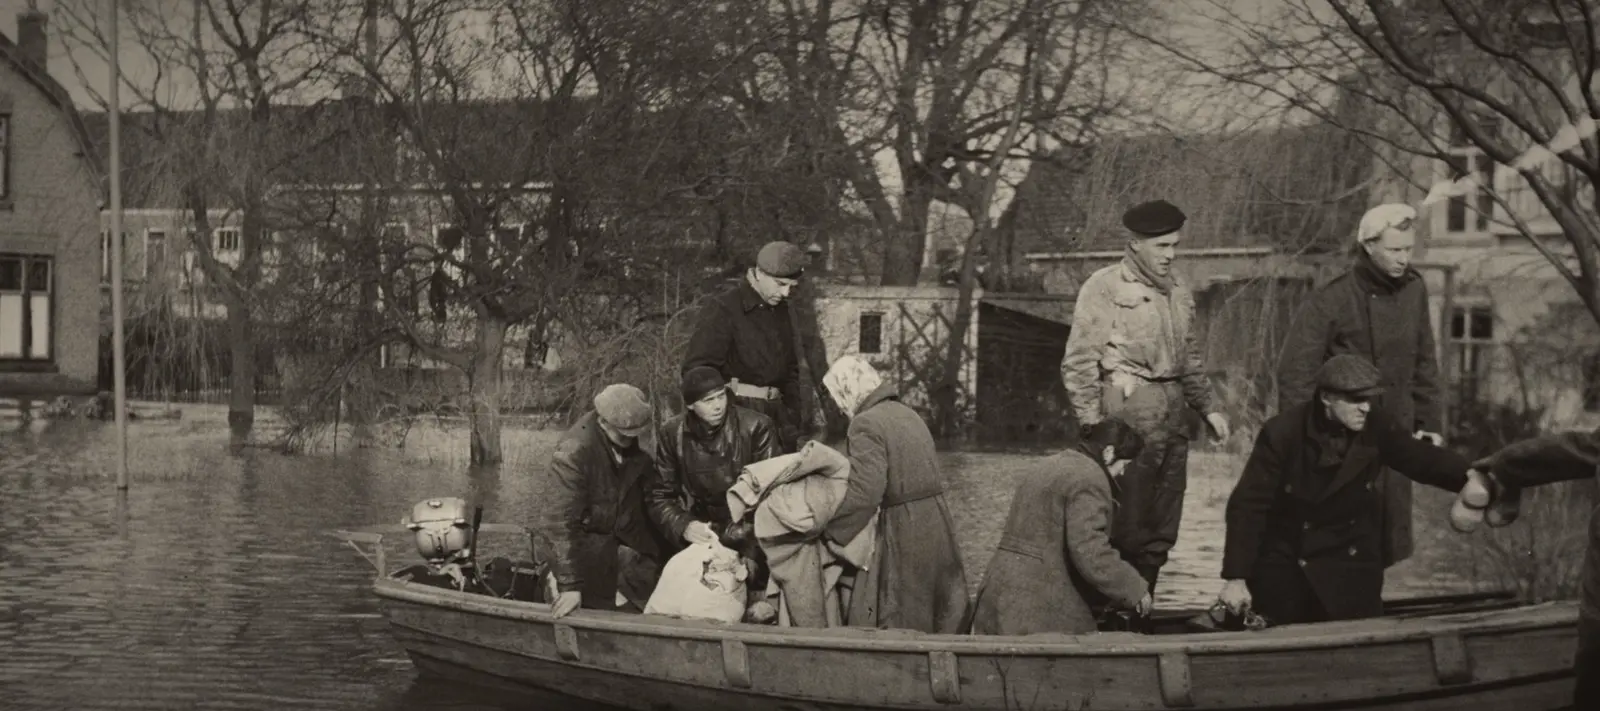
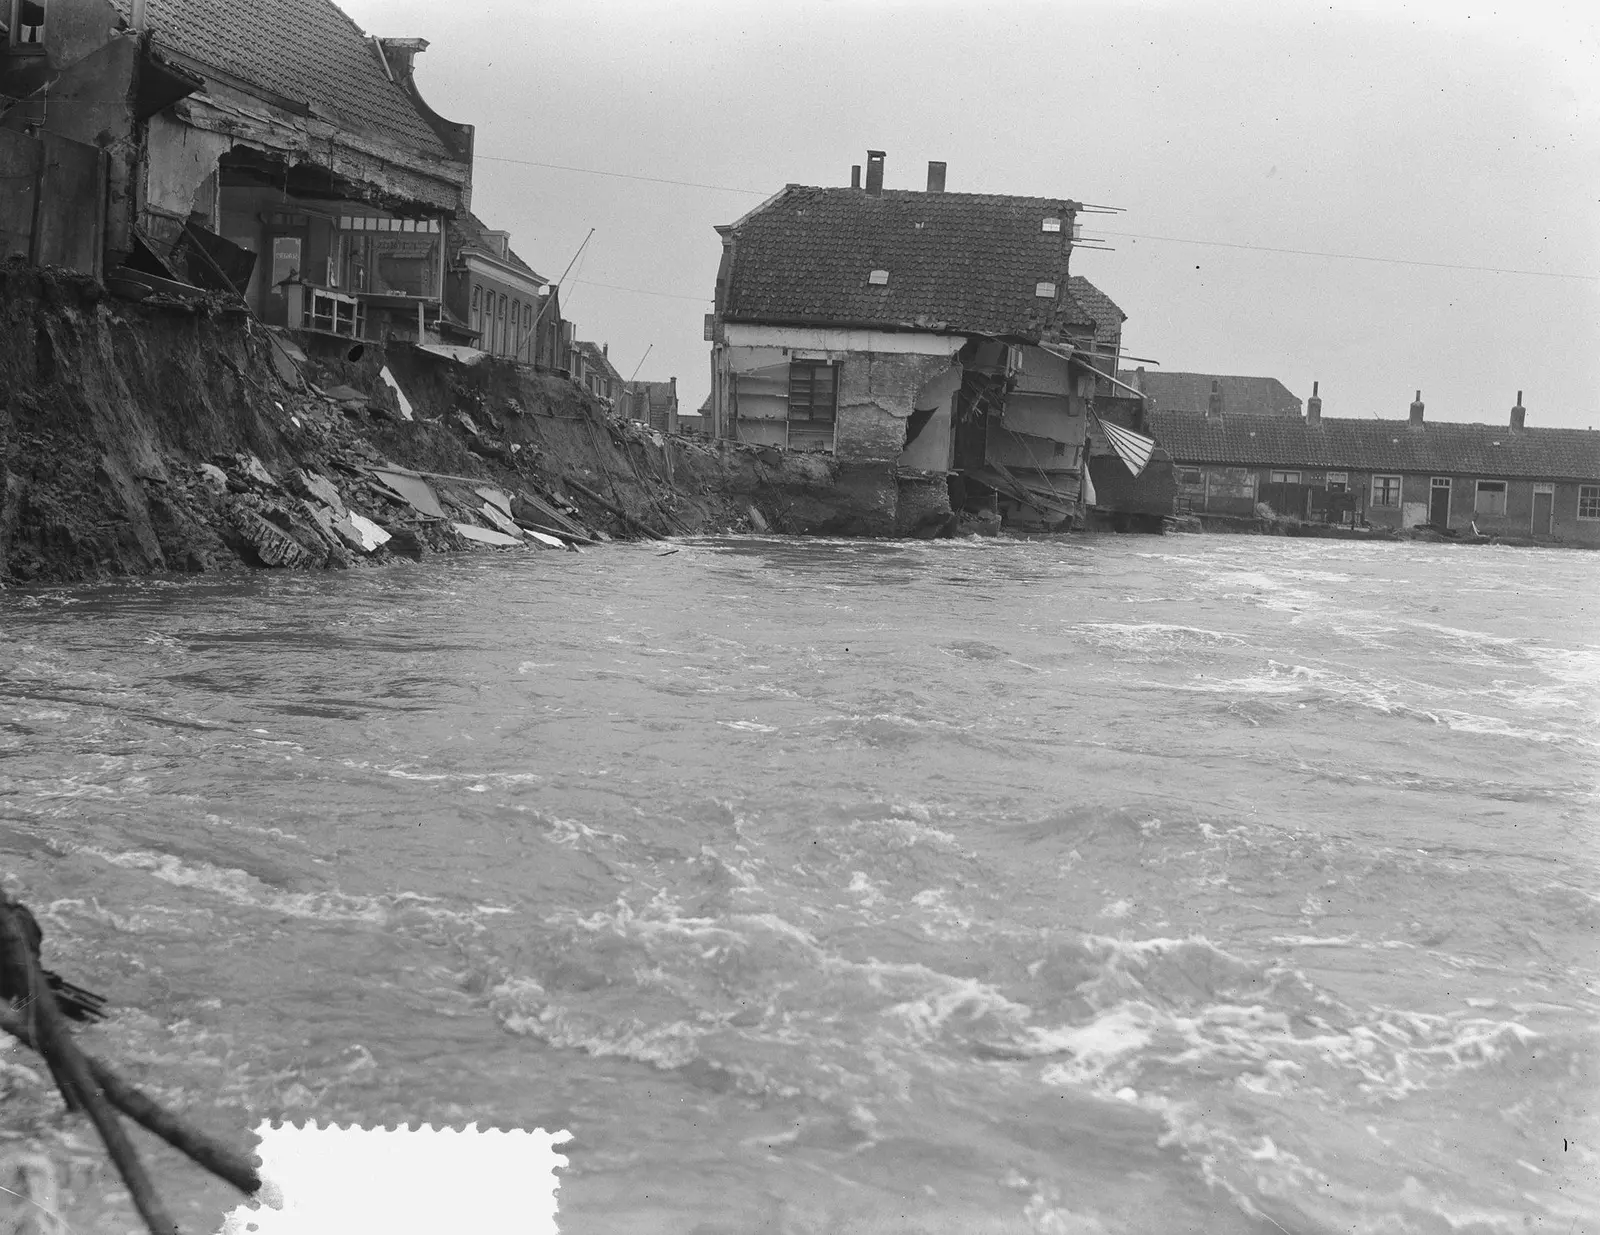
Dikes failed across Zeeland, South Holland and North Brabant. More than 150,000 hectares were flooded. In the Netherlands, 1,836 people died.
About 72,000 people were evacuated. 47,000 cattle drowned, and 4,300 homes and buildings were destroyed. The last gap in the dikes was closed at Ouwerkerk on 6 November 1953, more than nine months later.
The Delta Works shortened the coast
On 18 February 1953, less than three weeks after the flood, a Delta Committee was set up. Its answer was bold. Shorten the coast, by closing the estuaries.
For the heart of Holland, the target was a coast that would hold against a storm with a one in 10,000 chance in any year. In 1958, the plan became law, as the Delta Act.
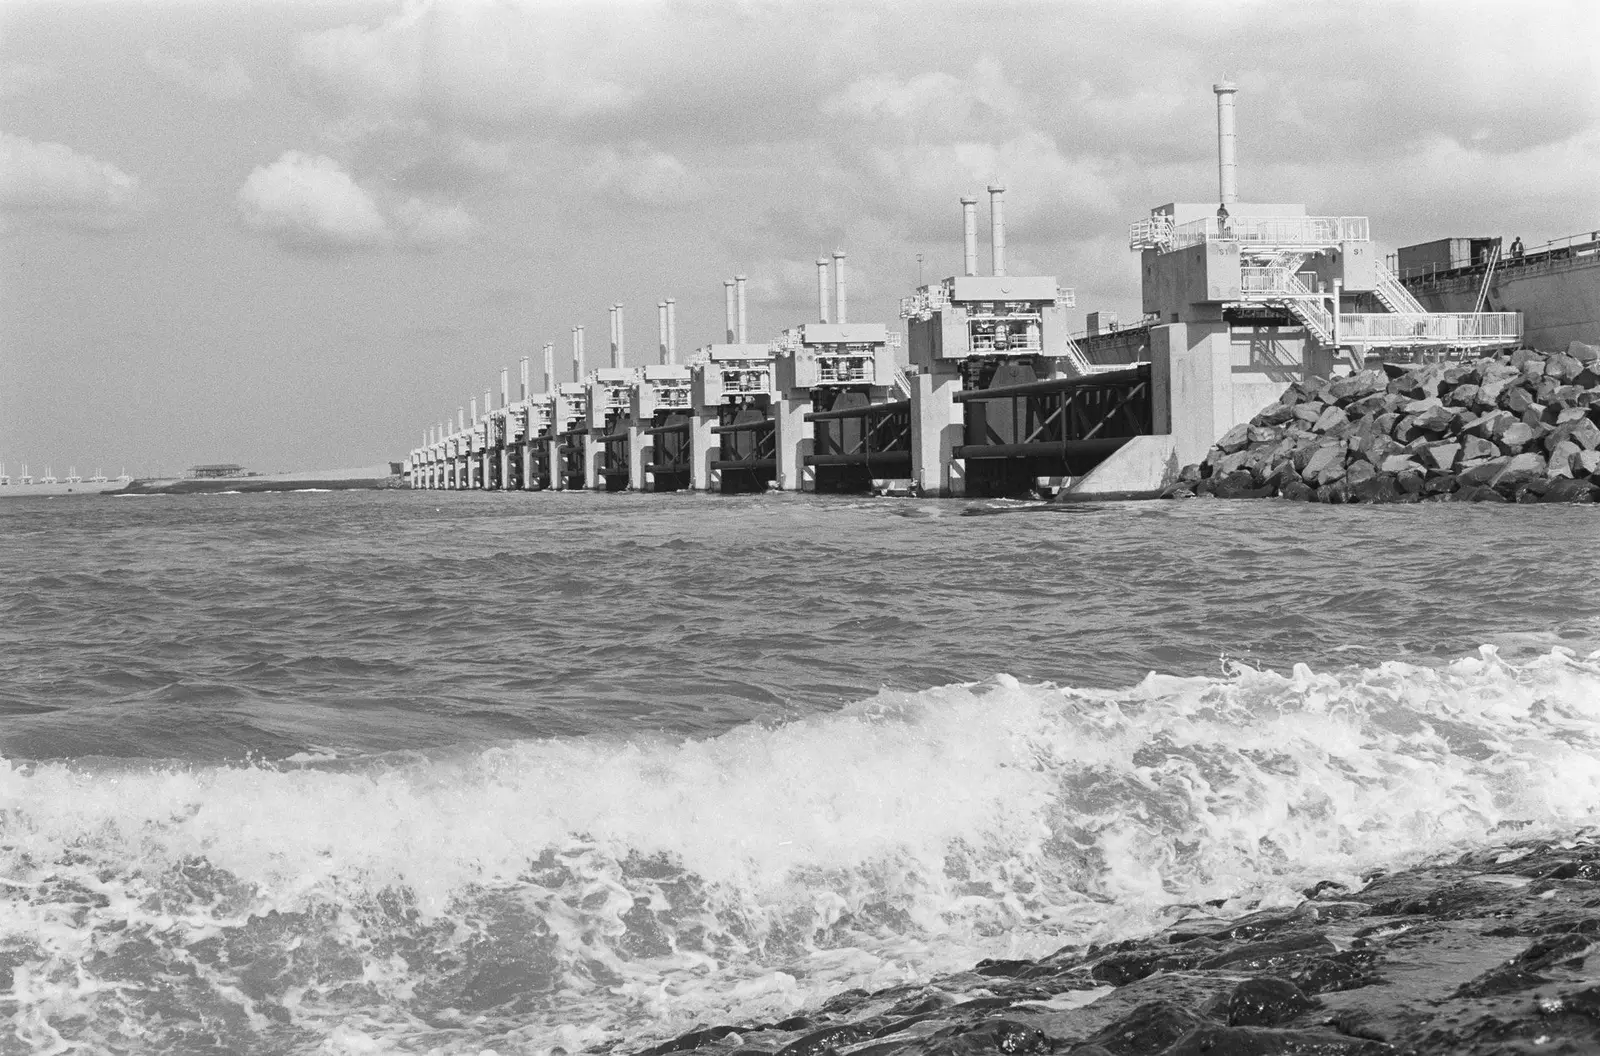
The Delta Works are 13 structures: six dams, two sets of sluices, and five storm surge barriers. The first, a barrier on the Hollandse IJssel, was working by 1958. One by one, through the 1960s and 1970s, the estuary mouths were closed.
Then came the Eastern Scheldt. A solid dam would have ended the tide, and the shellfish grounds with it. So the barrier was built open. About nine kilometres long, with 62 gates that drop only when a storm comes. It opened in 1986.
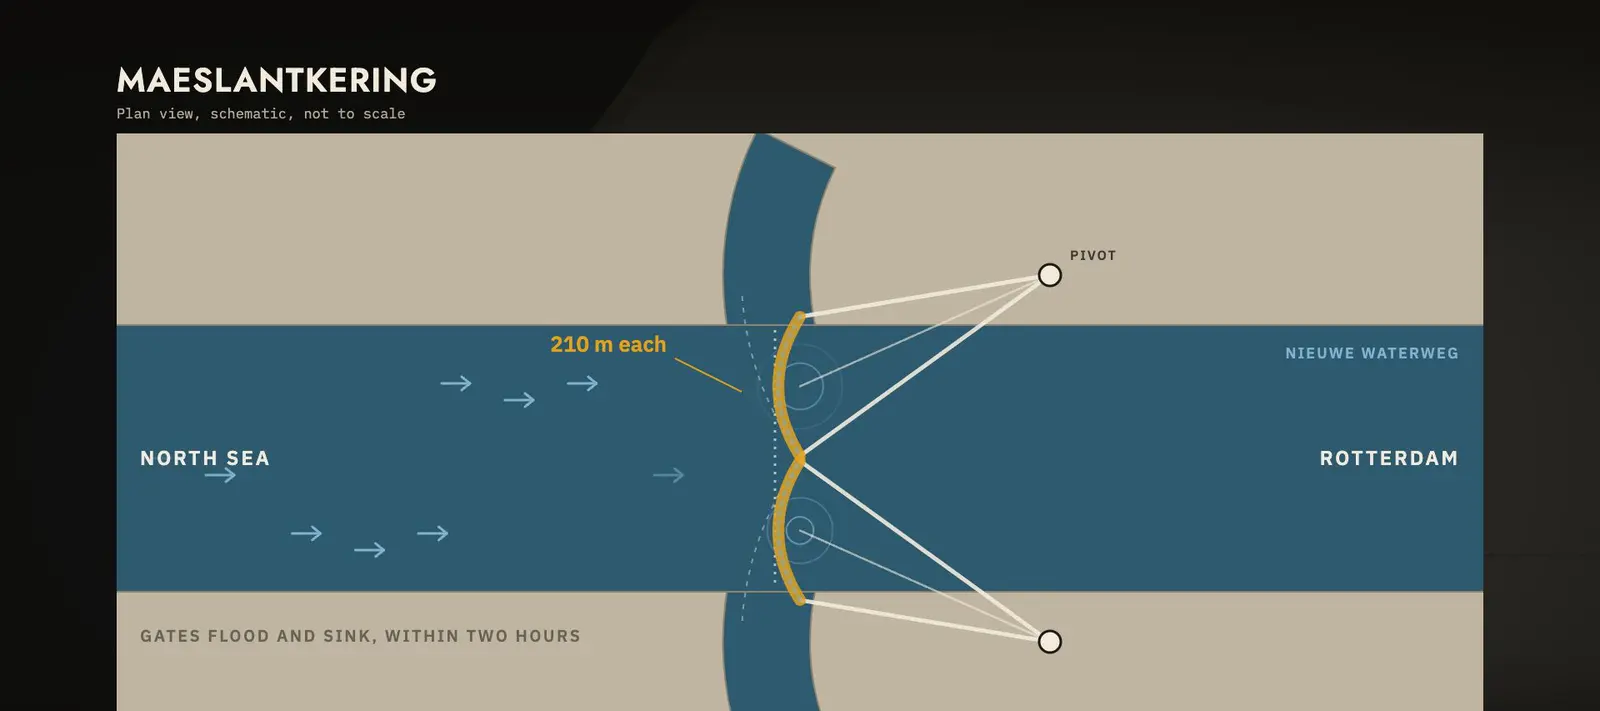
The last gap was the way to Rotterdam. Ships need the channel open. So the Maeslantkering was built: two floating gates, each 210 metres long.
In a surge, the gates swing out, fill with water, and sink to the bottom within two hours. It was finished in 1997, 43 years after the first Delta Work began.
It is set to close by itself when the water is forecast to reach 3 metres at Rotterdam. In 2007 and 2018 it closed in storms, at a lowered test level. On 21 December 2023, the real trigger was reached for the first time.
The rivers got more room
Water also comes from behind. The Rhine and the Maas bring rain and snowmelt from across Europe. After high water in 1993, the rivers rose again in 1995. More than 250,000 people had to leave their homes.
This time, the answer was not only higher dikes. In 2006, a programme called Room for the River was approved. At 34 places, the rivers were given more space.
Dikes were moved back. Floodplains were dug lower. Side channels were cut to carry water past towns. The aim was for the Rhine to carry 16,000 cubic metres a second safely to the sea.
The map today is still sinking
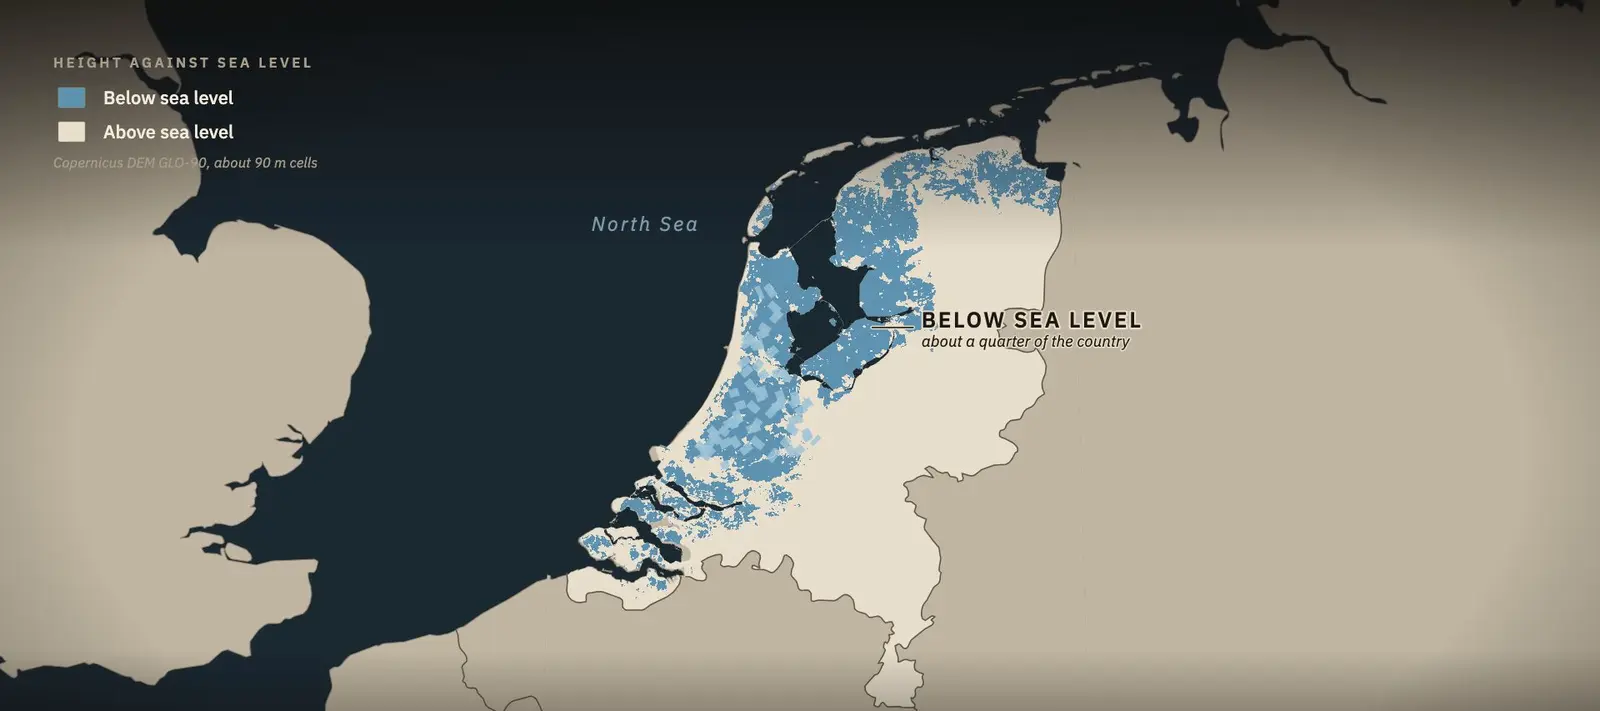
Here is the country by height. According to PBL, the Netherlands Environmental Assessment Agency, 26 per cent of the country is below sea level. Another 29 per cent is open to flooding from the rivers.
A United Nations climate report of 2007 once said 55 per cent lay below sea level. In 2010, PBL corrected it. The 55 per cent is the share at risk of flooding.
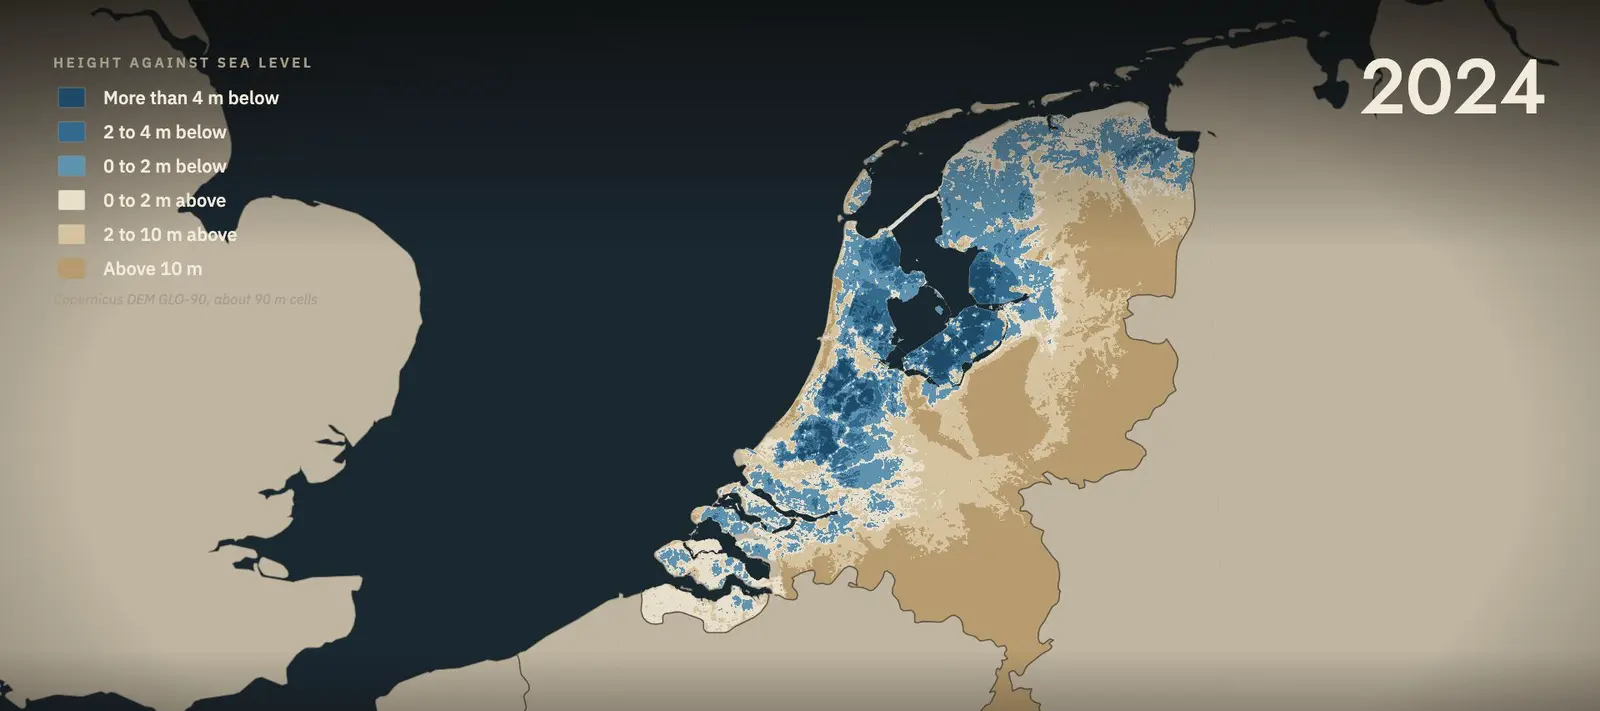
The lowest point is in the Zuidplaspolder, near Rotterdam, about 6.7 metres below the datum. Until about 1840, it was a lake.
And the peat is still sinking. About 9 per cent of the country is peat soil. In the peat meadows, the ground drops about 8 millimetres a year on average, faster in places. The pumps that keep it dry also keep it going down.
Won from the water, kept dry every day
A famous saying claims that God made the world, but the Dutch made the Netherlands. Who first said it is not known.
The map tells a stranger story. Some land was taken from the sea. But much of the land below sea level was lowered by people, draining and digging the peat.
The Netherlands was not won from the water once. It is kept from the water, every day, by the pumps.
Fact check and sources
The planning agency's figure, in its own correction:
“This should have read that 55 per cent of the Netherlands is at risk of flooding; 26 per cent of the country is below sea level, and 29 per cent is susceptible to river flooding.”
PBL Netherlands Environmental Assessment Agency, correction note
Checked against the record
- AD 1000 to 1300 When the draining began.
Between AD 1000 and 1300, the coastal peatlands were drained to create arable land in a cooperative effort, creating the water boards that still manage water in the Netherlands.
Erkens et al. 2016, introduction - Why it sank Peat, once drained.
physical compaction of peat and its degradation by oxidation lead to subsidence
Erkens et al. 2016 - 26% below NAP The map's own words.
26% of the Dutch land surface is below NAP
PBL
Sources
- PBL, correction of the IPCC wording, 2010
- Erkens, Van der Meulen and Middelkoop, Double trouble, Hydrogeology Journal 24, 2016
- PBL, Subsiding soils, rising costs, Dec 2016
- Schiereck and Visser, De Sint-Elisabethsvloed, Tijdschrift voor Waterstaatsgeschiedenis 30, 2021
- Rijkswaterstaat, Watersnoodramp 1953
- KNMI, Watersnoodramp 1953
- Delta Committee, Final Report, 1960
- Rijkswaterstaat, Deltawerken
- Rijkswaterstaat, Maeslantkering
- Rijkswaterstaat, Storm Pia, 21 Dec 2023
- Rijkswaterstaat, 100 jaar Zuiderzeewerken
- Rijkswaterstaat, Evacuatie 1995, Jan 2025
- Tweede Kamer, Room for the River, Jun 2016
- Staten-Generaal Digitaal, Flevoland law, 1985
- UNESCO, World Heritage, Beemster (899) and Kinderdijk (818)
- ASME, Landmark 153, Cruquius
- gemalen.nl, De Haarlemmermeerpolder
- Britannica, IJsselmeer Polders
- M. M. Dodge, Hans Brinker, 1865
- Elevation: produced using Copernicus WorldDEM-90 (c) DLR e.V. 2010-2014 and (c) Airbus Defence and Space GmbH 2014-2018 provided under COPERNICUS by the European Union and ESA; all rights reserved
- Map data: Natural Earth; OpenStreetMap contributors (ODbL)
Pictures on this page
- Nationaal Archief, Anefo 905-5477, G. W. van Duinen, 1953, CC0. CC0 1.0 · Source
- Rijksmuseum RP-P-AO-7bis-3, L. J. Sinck and others, c. 1612, public domain. Public Domain Mark 1.0 · Source
- Nationaal Archief, Van de Poll 252-0818, W. van de Poll, 1930, CC0. CC0 1.0 · Source
- Nationaal Archief, Anefo 933-7532, R. Bogaerts, 1986, CC0. CC0 1.0 · Source
- Film stills, loops, maps and diagrams: from the Backstory Report film, drawn from the sources above.
Every archive picture in the film, with its rights (26)
- Rijksmuseum RP-P-1939-624, J. Saenredam after A. Ortelius, 1589, public domain. Public Domain Mark 1.0 · Record
- Rijksmuseum RP-P-OB-80.776, anonymous after C. J. Visscher, c. 1610, public domain. Public Domain Mark 1.0 · Record
- Rijksmuseum SK-A-3147-A, Master of the St Elizabeth Panels, c. 1490, public domain. Public Domain Mark 1.0 · Record
- Rijksmuseum SK-A-3147-B, Master of the St Elizabeth Panels, c. 1490, public domain. Public Domain Mark 1.0 · Record
- Rijksmuseum SK-A-1505, P. J. C. Gabriel, c. 1889, public domain. Public Domain Mark 1.0 · Record
- Rijksmuseum RP-P-OB-5590, S. Savery after T. de Keyser, 1643, public domain. Public Domain Mark 1.0 · Record
- Rijksmuseum RP-P-AO-7bis-3, L. J. Sinck and others, c. 1612, public domain. Public Domain Mark 1.0 · Record
- Rijksmuseum RP-T-1963-39, A. le Comte, 1860 to 1921, public domain. Public Domain Mark 1.0 · Record
- Nationaal Archief, Anefo 901-4766, C. Breijer, 1946, CC0. CC0 1.0 · Record
- Nationaal Archief, Anefo 901-4770, C. Breijer, 1946, CC0. CC0 1.0 · Record
- Rijksmuseum RP-P-AO-9-40, G. Coeck after J. A. Leeghwater, c. 1640, public domain. Public Domain Mark 1.0 · Record
- Rijksmuseum RP-P-OB-28.402, W. Hekking jr., 1857 to 1904, public domain. Public Domain Mark 1.0 · Record
- Nationaal Archief, Van de Poll 252-0818, W. van de Poll, 1930, CC0. CC0 1.0 · Record
- Rijksmuseum RP-P-1940-1844, J. H. van Mastenbroek, 1932, public domain. Public Domain Mark 1.0 · Record
- Rijksmuseum RP-F-F19391, KLM Fototechnische Dienst, 1928, public domain. Public Domain Mark 1.0 · Record
- Rijksmuseum RP-F-00-24397, anonymous, 1943, public domain. Public Domain Mark 1.0 · Record
- Nationaal Archief, Anefo 901-7366, T. van Haren Noman, 1946, CC0. CC0 1.0 · Record
- Nationaal Archief, Anefo 908-3793, H. Pot, 1957, CC0. CC0 1.0 · Record
- Nationaal Archief, Anefo 905-5477, G. W. van Duinen, 1953, CC0. CC0 1.0 · Record
- Nationaal Archief, Anefo 905-5150, W. van Rossem, 1953, CC0. CC0 1.0 · Record
- Nationaal Archief, Anefo 933-7532, R. Bogaerts, 1986, CC0. CC0 1.0 · Record
- Rijksmuseum NG-501-18, B. F. van Berckenrode, 1629, public domain. Public Domain Mark 1.0 · Record
- Rijksmuseum RP-T-1894-A-2839, P. Jansz, 1667, public domain. Public Domain Mark 1.0 · Record
- Rijksmuseum RP-P-OB-77.006, R. de Hooghe, 1687, public domain. Public Domain Mark 1.0 · Record
- Rijksmuseum RP-P-OB-79.726, anonymous, printer E. Spanier, 1852, public domain. Public Domain Mark 1.0 · Record
- Wikimedia Commons, Spiegelwaal 03, Havang(nl), 2016, CC0. CC0 1.0 · Record

Corrections. None to this case so far. Every correction is dated on the sources and corrections page.
Related cases
All cases
Why the Mississippi Wants a New Path to the Sea
The Atchafalaya offers the Mississippi a route to the Gulf less than half as long. Gates have held it back since 1962.
Both Engines Fail Over New York
Geese took both engines at 2,818 feet. Three and a half minutes later the crew put the airliner on the river.
Why You Couldn't Take One Train Across Australia
The colonies laid three widths of track. Until 1962 no passenger train ran through from Sydney to Melbourne.